Ask a CIO what their agents cost last month and you get an invoice. Ask what one resolved claim, one reconciled ledger, or one closed ticket cost, and the room goes quiet. That gap is where 40 to 60 percent of agent spend hides, and most of it is not the model. It is the retry.
Most organisations running agents today can answer exactly one financial question: what the provider charged last month. It arrives as a handful of line items, a model, a token count, a total, and it is close to useless for managing anything.
The invoice tells you almost nothing
Here are the questions that actually get asked in the first week of any cost review, and that the invoice cannot answer.
- Which of our fourteen agents consumed the majority of the spend?
- What did one resolved customer case cost, end to end?
- How much of last month’s bill went on runs that ultimately failed?
- How much was spent re-sending the same system prompt and the same tool definitions, thousands of times a day?
- Which team should this be charged to?
- If volume triples next quarter, what is the bill?
The absence of these answers has a predictable consequence. Finance sees a line growing 20 or 30 percent a month with no unit denominator, and does the only thing available: imposes a cap. The cap lands on the agents that are working, because they are the ones with volume. I have watched genuinely valuable automation get throttled because nobody could express its cost per unit of work delivered.
The distinction worth internalising. Cost per token is a procurement metric. Cost per successful outcome is a management metric. Until you can produce the second one, per agent and per task type, every cost decision is a guess with a spreadsheet attached.
What is actually happening to the numbers
Unit prices collapse, total spend climbs
The price of a given level of model capability has fallen dramatically and repeatedly. Analyses from Epoch AI and others put the decline for equivalent benchmark performance at roughly an order of magnitude per year in recent periods. Most leaders have heard this and planned budgets around it.
The bills went up anyway. The reason is a textbook Jevons effect combined with a genuine change in workload shape. A chatbot turn consumes a few thousand tokens. An agentic task, meaning plan, retrieve, call tools, observe, re-plan, verify, produce output, consumes tens to hundreds of thousands, because the accumulated context is re-sent on every step of the loop. Add reasoning models that spend tokens thinking before answering, and multi-agent designs that fan one request out to several specialists, and per task consumption sits one to two orders of magnitude above what the budget assumed.
Cost management has caught up with AI
The FinOps Foundation extended its scope to AI explicitly, with FinOps for AI guidance and the FOCUS billing data specification adding coverage for AI and model inference costs, so spend can be normalised across providers and allocated the way cloud spend has been for a decade. The practical significance is that the allocation problem is considered solved in principle. Most organisations simply have not applied the pattern to token spend yet.
The instrumentation standard exists too
OpenTelemetry’s generative AI semantic conventions define standard span attributes for model calls, including operation name, request model, response model, and input and output token usage. That matters more than it sounds. Cost attribution does not require a proprietary agent framework. If your agents emit conformant spans, you can build a cost ledger over your existing observability pipeline in days rather than months.
The savings levers are documented and underused
- Prompt caching. Re-reading a cached prefix costs a fraction of a fresh read, typically around a tenth of the standard input rate, against a modest premium to write the cache. For agents whose system prompt, tool definitions, and policy text run to tens of thousands of tokens and are identical on every call, this is the highest return single change available.
- Batch processing. Roughly half price for work that tolerates asynchronous completion. Most eval runs, back office reconciliation, and overnight document processing qualify, and almost none of it is batched.
- Model tiering. Small models handle classification, extraction, routing, and formatting at a small fraction of frontier cost. Agents that call a frontier model for every step, including “which of these three categories is this”, are the norm rather than the exception.
Where I think the money goes
Token spend is not a model selection problem. It is an accounting problem followed by a control loop problem, and it is worth attacking in that order.
- Attribute before you optimise. Two weeks of instrumentation reliably changes which optimisation the team was about to spend a quarter on. The biggest line is almost never the one anyone predicted.
- Measure cost per successful outcome, not per call. Failed runs consume tokens and deliver nothing. Any metric that excludes them flatters the system and hides the retry problem entirely.
- Enforce budgets in the runtime. A monthly cost review cannot stop a runaway loop that burns a month’s budget in an afternoon. The ceiling has to be a per run token limit and a guard that can refuse a call.
- Fix retries before you change models. Model swaps are visible, political, and risky. Retry discipline is invisible, uncontroversial, and usually larger.
The one line worth repeating in a budget meeting. The cheapest token is the one you do not send twice. Before anyone debates model choice, find out what fraction of the monthly spend went into replaying context the model had already been given. In most estates I have looked at, the answer is between a quarter and a half.
How the plumbing fits
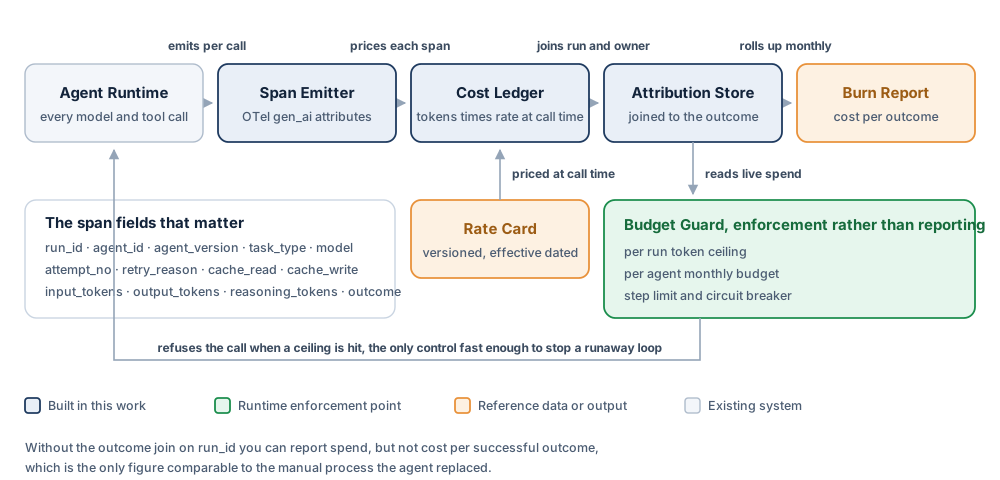
Attribution and enforcement are one pipeline, not two. The same ledger that produces the monthly burn report feeds the guard that can refuse a call mid run.
Inside the cost model
Instrument first, because you cannot recover what you did not capture
Cost attribution is a data modelling exercise and it is unforgiving about fields you skipped. Retrofitting is impossible, the tokens are gone. Three details are cheap now and expensive later.
- Price at call time against a versioned rate card. Rates change. A ledger that recomputes historical cost with today’s prices destroys your ability to explain a trend.
- Record cache reads and writes separately. Otherwise you cannot measure cache hit rate, the metric behind your single largest lever.
- Stamp
attempt_noandretry_reasonon every call. Without those two fields the retry problem is invisible in the data, and it is usually the largest line.
Five numbers, reported monthly
| Metric | Definition | Why it is the one to watch |
|---|---|---|
| Cost per successful outcome | Total spend on a task type divided by successful completions | The only figure comparable to the manual process it replaced |
| Waste ratio | Spend on failed, abandoned, and superseded runs divided by total spend | Where the recoverable money is. Above 20 percent is common and fixable |
| Retry amplification | Mean tokens per completed run divided by tokens of a first attempt run | Exposes full context replay. Above 1.6 means the retry path is naive |
| Cache hit rate | Cached input tokens divided by total input tokens | For a stable agent this should exceed 70 percent. Most start near zero |
| Frontier share | Spend on the largest model divided by total spend, split by task complexity | Reveals frontier models doing classification work |
Six places the waste concentrates
The shares below are indicative ranges rather than a fixed distribution, but the ordering has been remarkably stable everywhere I have looked.
| Source of waste | Share | Signal that reveals it | The fix |
|---|---|---|---|
| 1 · Retry with full context replay | 20 to 35% | retry amplification above 1.6 | delta repair and a circuit breaker |
| 2 · No prompt caching | 15 to 30% | cache hit rate near zero | stable prefix and cache breakpoints |
| 3 · Over-modelling simple steps | 10 to 25% | frontier share high on low complexity tasks | model cascade with escalation |
| 4 · Context bloat | 8 to 20% | input tokens rising with conversation length | retrieve spans, summarise, prune |
| 5 · Unbounded loops and fan out | 5 to 15% | long tail of runs at the token ceiling | step budget and per run ceiling |
| 6 · Interactive pricing on batchable work | 3 to 10% | synchronous calls outside business hours | batch endpoint, roughly half price |
Rows 1 and 2 require no quality trade-off at all. They are engineering defects rather than cost and quality decisions, which is why they come before any model downgrade conversation.
The anatomy of the largest line
Retrying is correct behaviour. The problem is the standard implementation. When a tool call fails validation, most agent frameworks append the error to the conversation and re-send the whole thing. Context therefore grows with each attempt, and because input tokens dominate agentic workloads, cost grows with it.
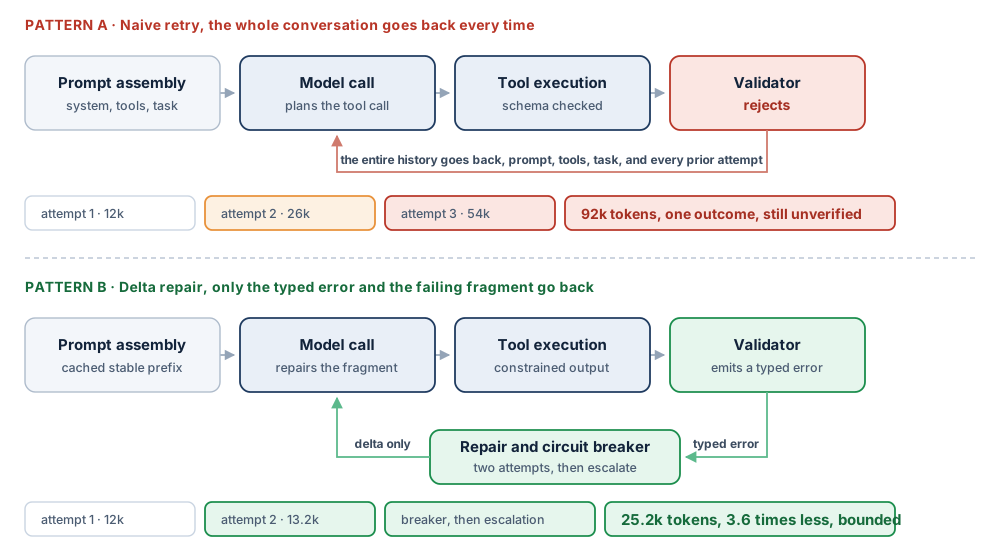
The saving does not come from retrying less. It comes from changing what gets re-sent. Delta repair with a circuit breaker also produces a bounded worst case per run, which is what makes capacity planning possible.
A retry taxonomy, and the right fix for each
| Retry cause | What usually happens | What works better |
|---|---|---|
| Transient infrastructure (timeout, 429, 5xx) | Immediate retry, same payload | Exponential backoff with jitter, idempotency key, no context change. Should cost almost nothing extra |
| Schema or format violation | Append error, resend everything | Constrained decoding or structured output first. If it still fails, send the typed error and the failing fragment only |
| Business rule validation failure | Resend with “you made a mistake” | Return the specific rule violated and the field. Vague feedback produces vague corrections and a third attempt |
| Judge or guardrail rejection | Regenerate from scratch | Cap regeneration at one attempt. A second rejection is a routing decision, not a retry |
| Planner thrash | Nothing, it runs until the timeout | Progress detection on repeated states, a hard step budget, and abandon then escalate. This is the tail that produces the shocking single run costs |
The four structural levers, in the order I would apply them
- Cache the stable prefix. Order the prompt so everything invariant, meaning system instructions, tool definitions, policy text, and few shot examples, sits at the front and never changes within a session. Volatile content goes last. Usually a one day change with the largest single return on this list.
- Fix the retry path. Typed errors, delta repair, circuit breakers, step budgets. Two to three weeks, no quality trade-off.
- Route by complexity. A cascade, meaning a small model attempts and escalates to a larger model when confidence is low or validation fails, rather than one model for every step. Needs eval coverage to do safely, which is why it comes third.
- Batch what does not need to be interactive. Evals, overnight processing, bulk document work. Pure scheduling change, roughly half price.
A caution on cascades. Model downgrade is the lever executives reach for first and the one most likely to backfire. A small model that fails and escalates has cost you both calls plus a latency penalty. Cascades only pay when the small model’s success rate on the routed slice is genuinely high, which you can only know from eval data. Never route by cost alone, route by measured success rate on that task type.
The monthly burn report
One page, same shape every month, circulated to engineering and finance together.
- Total spend, with the trend and the volume denominator alongside it
- Cost per successful outcome by task type, against last month and against the manual baseline
- Top five agents by spend, and by cost per outcome, deliberately two rankings because they rarely agree
- Waste ratio, meaning spend on failed, abandoned, and superseded runs
- Retry amplification and cache hit rate, per agent
- The five most expensive individual runs with links to their traces, which generates more engineering value per square inch than anything else on the page
- Forecast at current growth, and headroom against budget
Six weeks to a real number
| Week | What gets done | How you know it worked |
|---|---|---|
| 1 | Span schema agreed and emitted from one agent. Rate card loaded, versioned, effective dated. | Any single run can be priced end to end |
| 2 | All agents instrumented. Outcome join on run identifier. First burn report, unedited. | Cost per successful outcome exists per task type |
| 3 | Waste analysis: retry amplification, cache hit rate, frontier share, the expensive tail. | A ranked list of waste sources with a value on each |
| 4 | Prompt restructured for caching. Per run token ceiling and step budget enforced in the runtime. | Cache hit rate above 60 percent, no run exceeds the ceiling |
| 5 | Retry path rebuilt: typed errors, delta repair, circuit breaker, escalation instead of a third attempt. | Retry amplification below 1.3 |
| 6 | Routing cascade on the highest volume simple task, gated by the eval suite. Batch migration for offline work. | No quality regression on the eval gate |
What I have learned doing this
- The first burn report is always uncomfortable, and that is its value. In one case a single agent nobody could name accounted for a third of the monthly bill. It turned out to be an internal test harness left running against production models since a pilot ended.
- Optimise the tail before the mean. Agent cost distributions are heavily skewed. The top one percent of runs frequently carries ten to twenty percent of spend, and those runs are almost always loops that should have been terminated.
- Cache invalidation is where the savings leak back out. A single dynamic value, a timestamp or a session identifier, placed near the front of the prompt destroys the cached prefix. Worth checking prompt assembly order in code review for exactly this reason.
- Show cost in the developer’s own loop. Print cost per run in local development and in pull request checks. Engineers optimise what they can see, and a number in a monthly report is not visible.
- Never let cost control turn off surveillance. Eval and monitoring spend is the last thing to cut and frequently the first thing proposed. Ring-fence it.
What it is worth
A worked example on an illustrative mid-size deployment. The rate card here is representative rather than any provider’s current pricing, so substitute your own. The ratios between the lines are far more stable than the absolute figures.
| Line | Before | Change made | After | Monthly saving |
|---|---|---|---|---|
| Volume | 250,000 runs | unchanged | 250,000 runs | none |
| Mean tokens per completed run | 41,000 | delta repair, step budget | 26,000 | none |
| Input tokens billed at full rate | 92% | stable prefix caching | 28% | $34,000 |
| Retry amplification | 1.9 times | typed errors, circuit breaker | 1.2 times | $21,000 |
| Frontier model share of calls | 100% | cascade on 3 simple task types | 54% | $16,000 |
| Offline work on interactive pricing | 18% of spend | batch endpoint | 2% | $7,000 |
| Runs abandoned at timeout | 4.1% | progress detection, escalation | 0.6% | $5,000 |
| Cost per successful outcome | $0.61 | $0.24 | 61% reduction |
What improves beyond the invoice
- The case for the next agent becomes writable. Cost per outcome against the manual baseline is the sentence that gets funding approved. Without it, every proposal is a leap of faith and gets treated as one.
- Capacity planning becomes possible. A bounded worst case per run turns “what happens if volume triples” from an anxiety into arithmetic.
- Showback ends the cross-subsidy argument. When each team sees its own burn, the conversation moves from “AI is expensive” to “this specific workflow is expensive, and here is what it returns”.
- Reliability improves as a side effect. Circuit breakers, step budgets, and progress detection are cost controls that happen to be stability controls. More than once the incident rate improvement turned out to be the more valuable outcome.
- Model migration gets cheap. A rate card, a ledger, and cost per outcome mean evaluating a new model is a scorecard comparison rather than a project.
Where I would start on Monday
- Instrument this month, optimise next month. Two weeks of span emission will change what you optimise. Do not skip ahead.
- Publish an unedited first burn report, including the embarrassing lines. The organisational effect of a real number is larger than any technical change on this list.
- Fix caching and retries before touching model choice. The two largest levers, no quality trade-off, and together they routinely deliver half the total saving.
- Put a hard token ceiling on every run today. One line of configuration. It caps your worst possible day, and it is the only item here that works before you have any telemetry at all.
- Report cost per successful outcome monthly, next to the manual baseline it replaced. That is the number that keeps the work funded.
- Ring-fence eval and monitoring spend. The cheapest month you will ever have is the one before an undetected quality incident.
If you only do one thing. Add
attempt_noandretry_reasonto your model call spans. It takes an afternoon, and it makes the single largest line of waste in most agent estates visible for the first time.
If you want to read further
- FinOps Foundation, FinOps for AI and the FOCUS specification. Allocation, showback, and normalisation patterns, now extended to AI and inference spend. finops.org
- OpenTelemetry, semantic conventions for generative AI. The standard span attributes to emit so your cost ledger stays portable across providers and frameworks. opentelemetry.io
- Anthropic, prompt caching documentation. Cache breakpoints, prefix stability, and the read and write economics behind the largest single lever here. docs.claude.com
- Anthropic, Message Batches API. The batch discount and its constraints, for offline and eval workloads. docs.claude.com
- Epoch AI, trends in the cost of LLM inference. The data behind “unit prices fall, total spend rises”. epoch.ai
- Langfuse and LangSmith cost tracking documentation. Two practical implementations of run level cost attribution if you would rather adopt a ledger than build one. langfuse.com/docs
- Companion piece: Two Clocks, One Library. You need the eval gate before you can safely route to cheaper models. nareshbabu.me/blog
The short version
@NBA.naresh · linkedin.com/in/naresh-babu-anapakala-72734534
- Per token prices keep falling and total spend keeps rising. Agentic workloads consume one to two orders of magnitude more tokens per task than the chatbot workloads budgets were sized against.
- The unit of measurement is wrong almost everywhere. Teams track cost per call. The number that matters is cost per successful outcome, and it is usually two to four times higher than anyone assumes.
- Retries are the largest single source of waste, not because retrying is wrong, but because the standard implementation replays the entire conversation, so attempt three can cost four times attempt one.
- Attribution is the prerequisite. Without a span level cost ledger you cannot say which agent, team, or task burned the money, and every optimisation becomes guesswork.
- Instrument first, optimise second, and 45 to 65 percent off cost per successful outcome inside a quarter is a realistic target with no measurable quality loss.
Written by Naresh Babu Anapakala. If your burn numbers look nothing like these, I would genuinely like to hear about it on LinkedIn.
Rate cards, discount structures, and model pricing change frequently. Every monetary figure here is illustrative and drawn from the shape of the problem rather than a current price list. Re-derive with your own rate card and volumes before using any of it in a business case.